
Company culture. Churn. Burnout. Workload. Workplace happiness.
Running a company means keeping a workforce engaged and motivated by a shared sense of
purpose. Many factors influence workplace happiness, from compensation and workload to
management style and flexibility. But some matter more than others.
To better understand what drives happiness at work, we surveyed 997 full-time US workers. We
examined on-the-job factors such as role clarity, workload, and managerial support, as well
as off-the-clock factors including debt, relationships, and exercise. The results reveal
clear patterns between happy and unhappy workers.
Top factors for worker happiness
Among surveyed workers, 73% said they are happy at work, while 27% reported being unhappy.
So what separates the two groups?
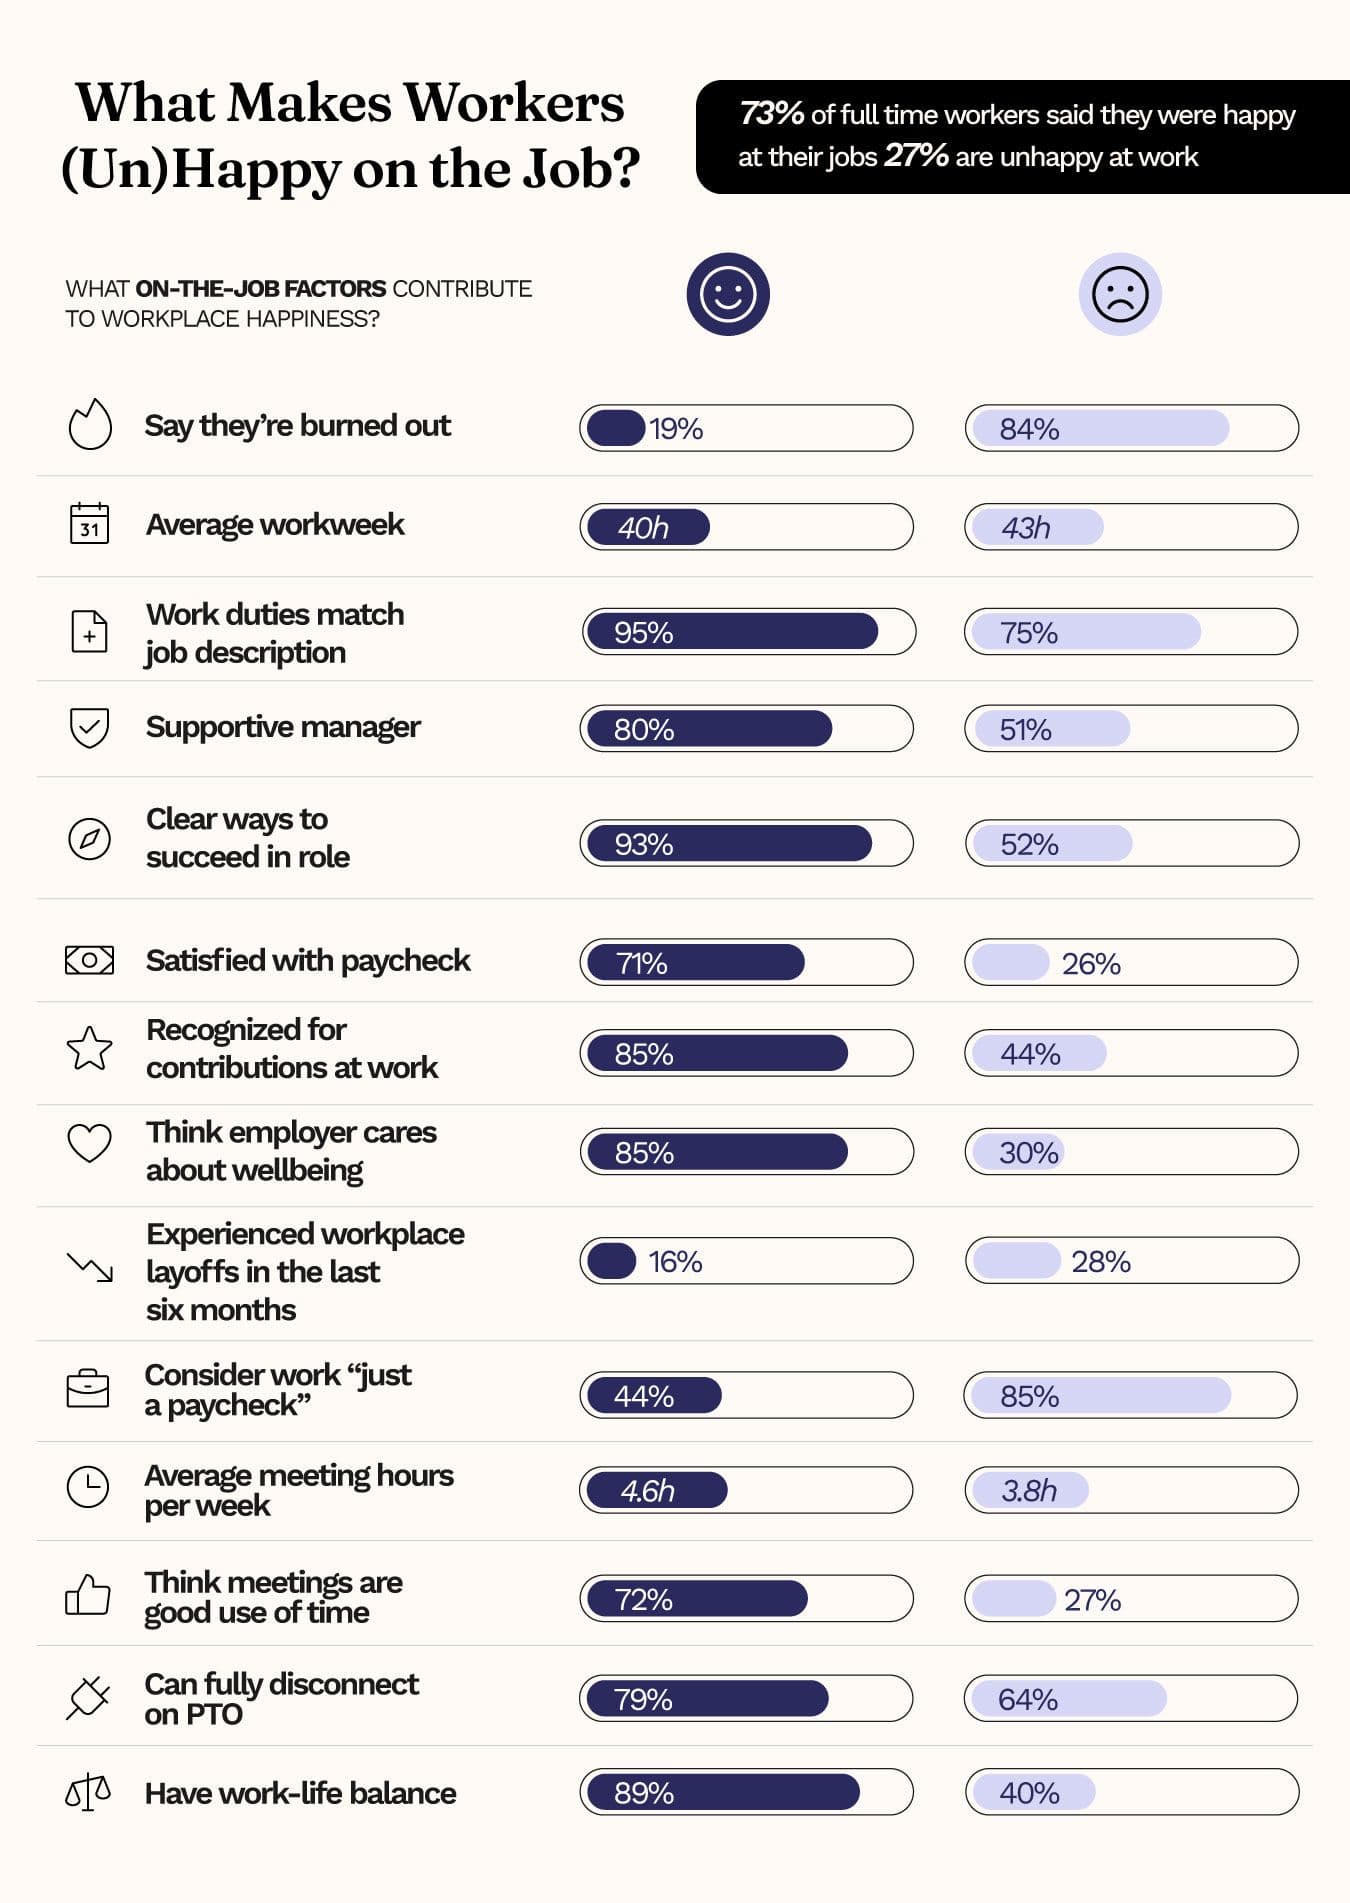
Burnout is one of the strongest indicators of unhappiness. It affects 84% of unhappy
workers. Burnout is not limited to unhappy employees, however. It also affects 20% of happy
workers. Unhappy workers work an average of 3 more hours per week than their happy
counterparts.
Happy workers are more likely to have predictable jobs. About 95% say their duties align
with their job descriptions, 80% report having supportive managers, and 93% say they have
clear paths to success. Unhappy workers report much lower alignment. Only about 60% say
their duties match their role, 50% have supportive managers, and just over 50% feel they
know how to succeed.
Compensation is one of the largest gaps between the two groups. Only 25% of unhappy workers
are satisfied with their pay, compared to 71% of happy workers. This disparity affects how
employees perceive their employers. Just 30% of unhappy workers believe their employer cares
about them, versus 85% of happy workers. Recognition follows a similar pattern, with 85% of
happy workers feeling recognized compared to just 44% of unhappy workers.
Even among happy employees, work is not always fulfilling. About 44% of happy workers say
their job feels like just a paycheck, compared to 88% of unhappy workers. Job security also
plays a role. About 17% of happy workers experienced layoffs in the past 6 months, compared
to 28% of unhappy workers.
Work-life balance stands out as a defining factor. About 89% of happy workers say they have
good work-life balance, compared to just 40% of unhappy workers.
AI on the job
Attitudes toward AI were similar across both groups. About 50% of respondents use AI in some
capacity at work, and 29% are required to use it. Another 13% said they would face
consequences for not using AI tools.
AI is not universally reducing workload. About 20% of workers said AI increased their
workload, while 52% said it made their work easier.
How much pay makes workers happy?
We also looked at income levels to identify when happiness exceeds the national average of
73%. Worker happiness rises notably at salaries between $75,001 and $100,000. The highest
levels of happiness were reported by workers earning more than $200,000 annually.
Happiest and unhappiest job sectors
We asked respondents about their job sectors to see where happiness varies most. Some
industries clearly stand out.
Happiest job sectors
- Nonprofit (90%)
- Science and research (89%)
- Construction and trades (82%)
How life factors contribute to workplace
happiness
Work does not exist in a vacuum. External factors influence how employees feel on the job.
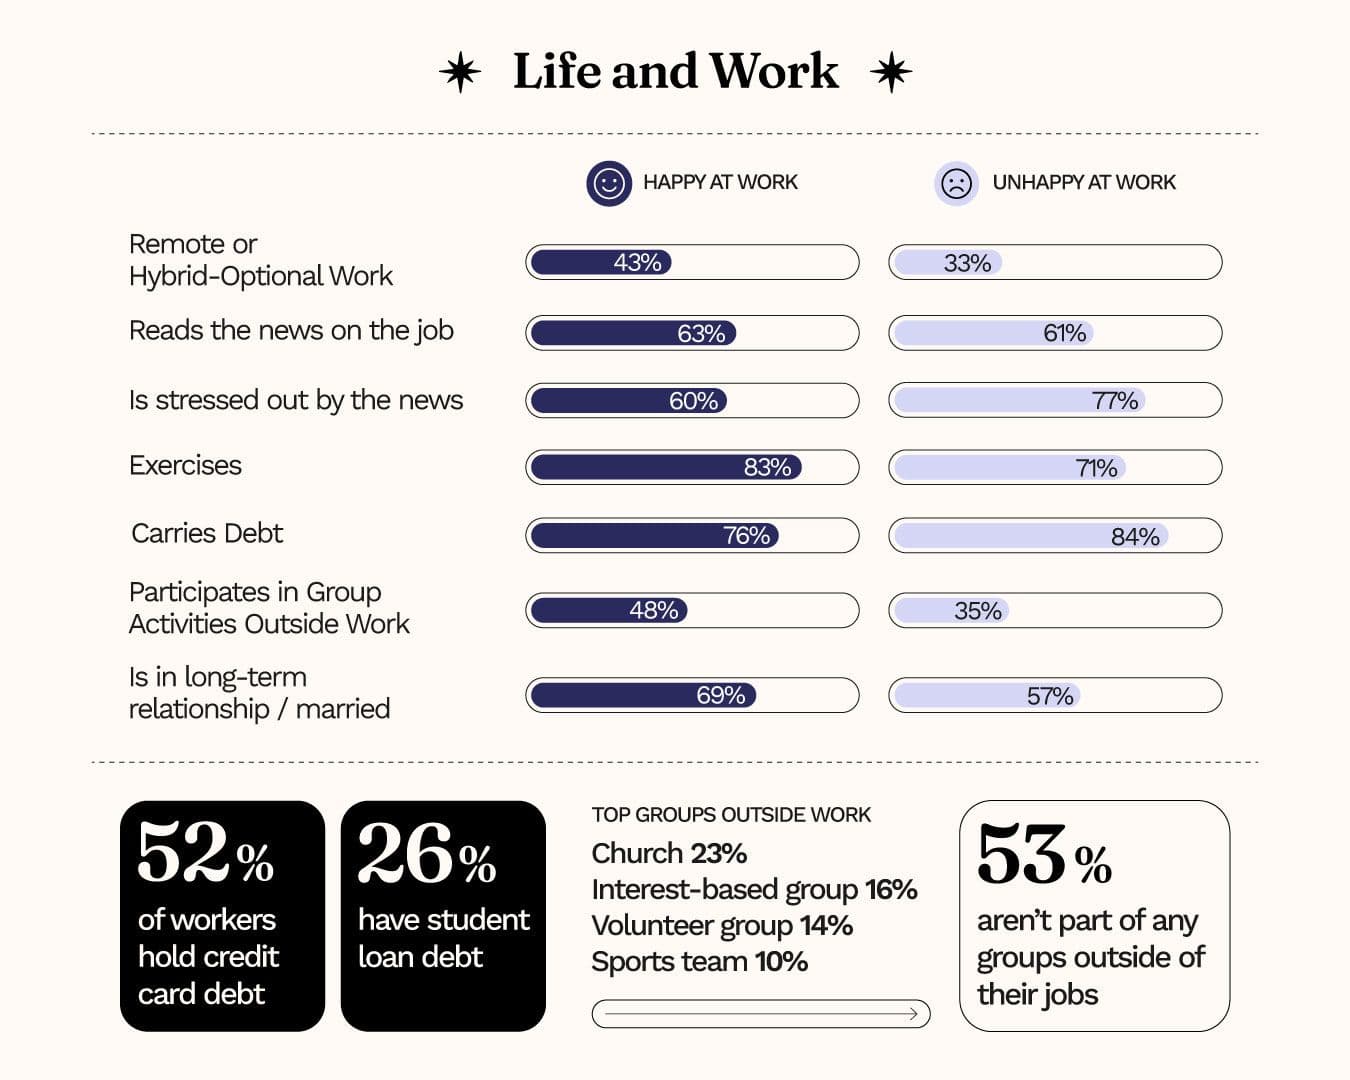
Work setup plays a meaningful role. Happy workers are 10% more likely to have remote or
optional hybrid arrangements. Only about 33% of unhappy workers report the same flexibility.
Both groups report reading the news during work hours, but unhappy workers are significantly
more affected by it. About 77% of unhappy workers say current events increase their stress,
compared to 60% of happy workers.
Lifestyle habits also differ. Happy workers report higher rates of exercise, community
involvement, and long-term relationships, each by about 10%. Debt shows the opposite trend.
About 84% of unhappy workers carry debt, compared to 76% of happy workers.
Community involvement appears to support work-life balance. Respondents most commonly
participate in church groups (23%), interest-based groups (16%), volunteer organizations
(14%), and sports teams (10%). Still, about 53% of respondents are not part of any group
outside of work, which may contribute to lower overall well-being.
Supporting employee happiness is critical for any employer. At Howdy, our 98% retention rate
reflects our focus on helping teams stay motivated, supported, and recognized. If you are
looking to build a happier, more resilient workforce, book a demo and see how Howdy helps
companies hire and retain top tech talent.
Methodology and fair use
In late January 2026, we surveyed 997 full-time US employees about workplace happiness and
related factors. Respondents ranged in age from 19 to 76, with an average age of 44. The
sample included 49% men, 49% women, and 2% nonbinary or undisclosed.
For media inquiries, contact [email protected].
When using this data, please attribute by linking to this study and citing Howdy.com.
WRITTEN BY